Despite facing rising costs and interconnection challenges, the U.S. Solar Industry continued its ascent in 2024, adding approximately 40.5 GWdc of capacity, marking a 4% year-over-year growth. This growth wasn’t uniform, however, as different market segments—Utility-Scale, Commercial & Industrial (C&I), Community Solar, Residential Solar, and Solar + Storage—experienced varying levels of success and challenges. Here’s a breakdown:
Quarterly Solar Capacity Growth in 2024
Q1 2024: The year started strong, as 11.8 GWdc of solar capacity was installed in Q1, marking the industry’s second-largest quarter to date. This momentum underscored strong utility-scale project completions and favorable policy impacts, such as tax incentives from the Inflation Reduction Act (IRA).
Q2 2024: Q2 witnessed a slight decline in capacity growth, with 9.4 GWdc added—a 21% drop from Q1 but a notable 29% increase compared to Q2 2023. The residential solar market faced headwinds from rising interest rates, impacting customer financing.
Q3 2024: The industry added 8.6 GWdc, reflecting a 13% decrease from Q2 but a 21% year-over-year increase. Supply chain improvements stabilized utility-scale installations, although the residential market continued to slow.
Q4 2024: Q4 is estimated to close with 10 GWdc of installations, bringing the annual total to 40.5 GWdc. This represents a 4% growth compared to 2023’s total of 32.4GWdc.
Segment-Specific Growth in 2024
Utility-Scale Solar:
Utility-scale solar remained the backbone of the industry, contributing the majority of the 2024 capacity additions.
- Capacity Added:
- Over 27 GWdc, accounting for nearly 67% of total installations,
- Key Drivers:
- Long-term Power Purchase Agreements (PPAs) with utilities and corporations.
- Tax incentives under the Inflation Reduction Act (IRA), reducing costs and ensuring economic viability.
- States like California and Texas led the way, with large-scale solar farms complemented by energy storage systems to stabilize the grid.
- Challenges:
- Interconnection delays and bottlenecks in permitting slowed project timelines.
- Supply chain disruptions, though improved from 2023, continued to impact material availability.
Commercial & Industrial (C&I) Solar:
C&I solar expanded steadily as businesses prioritized clean energy to meet sustainability goals and manage energy costs.
- Capacity Added:
- Approximately 5 GWdc, reflecting a 12% year-over-year increase.
- Key Drivers:
- Growth in corporate sustainability commitments, with businesses seeking solar and storage solutions to achieve carbon neutrality.
- Adoption of innovative financing models like green leases and energy-as-a-service, making solar more accessible.
- Challenges:
- High interest rates impacted financing for small-to-medium-sized businesses.
- Urban C&I projects faced space and permitting constraints
Community Solar:
Community solar programs experienced robust growth, with increased capacity and subscriber enrollment.
- Capacity Added:
- Approximately 4 GWdc, representing a 16% increase over 2023.
- Key Drivers:
- State policies in Minnesota (Solar Rewards Community), New York (NY-Sun), and Illinois (Adjustable Block Program) supported new projects and subscriber acquisition.
- Consumer demand for affordable, offsite renewable energy options
- Challenges:
- Delays in utility interconnection approvals slowed some project launches.
- Subscriber churn and education remained areas needing improvement.
Residential Solar:
The residential market faced a more challenging year, as rising interest rates and financing costs impacted consumer decisions.
- Capacity Added:
- Around 7 GWdc, a 26% decline compared to 2023.
- Key Drivers:
- Homeowners increasingly sought battery storage solutions alongside solar installations to enhance resilience.
- States like California, under NEM 3.0, saw a shift in installation patterns as net metering changes influenced consumer economics.
- Challenges:
- Financing difficulties for middle and low-income homeowners.
- Workforce shortages slowed installation timelines.
Solar + Storage:
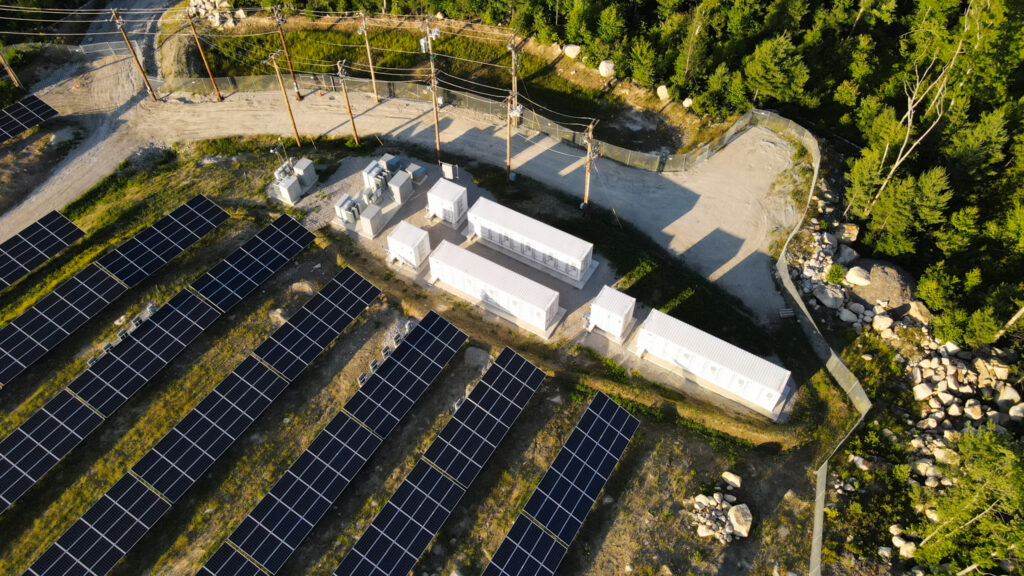
Solar and storage integration surged, reflecting the growing need for grid stability and renewable energy reliability.
- Capacity Added (storage):
- A record-setting 9.9 GWh of energy storage capacity deployed in 2024, often paired with solar projects.
- Key Drivers:
- Community solar projects paired with storage are becoming a trend.
- Increasing adoption in residential and C&I segments, as battery costs decreased and resilience became a top priority.
- Storage helped mitigate curtailment and enabled energy use during peak demand periods, enhancing the value of solar projects.
- Challenges:
- Supply chain constraints for batteries, particularly lithium-ion, and permitting delays.
What to Expect in 2025
Looking ahead, the U.S. solar and storage industries are expected to maintain momentum:
- Growth Projections: Annual installations are forecasted to exceed 43 GWdc, driven by continued utility-scale expansions and recovering residential demand.
- Emerging Markets: States like Pennsylvania are exploring new community solar programs, while established markets like Illinois plan to expand existing frameworks.
- Technological Advancements: Improvements in panel efficiency, storage technology, and hybrid systems will drive cost reductions and performance gains.
Sources:
- SEIA Solar Market Insight Report Q4 2024 – https://seia.org
- Wood Mackenzie Energy Storage Monitor Q3 2024 – https://woodmac.com
- Clean Power Annual Report 2024 – https://cleanpower.org
- Solar Power World Articles – https://solarpowerworldonline.com
- Energy Storage News – https://energystoragenews.com
- BloombergNEF Solar Market Report


